
You can create a TextGrid object by following "New" menu → "Create TextGrid…" or select the sound you want to annotate, then use the dynamic buttons: "Annotate" → "To TextGrid" and then you will see a window as Figure 5.1 which contains the start time(s), end time(s) and tiers names (be sure to write all the tiers names), and they are interval tiers by default If you have point tier, just put in "Which of these are point tiers", if you have no point tier, you can just leave it as blank.
Figure 5.1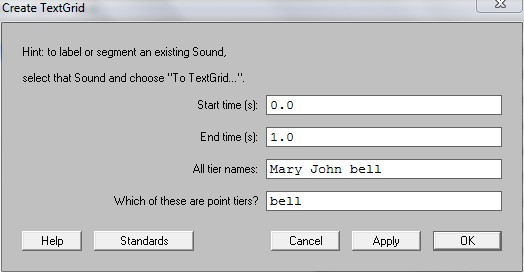
You need to identify segmentation categories by changing the names under the "Tier names" option, e.g., words syllables sounds (use space to separate names). So, the labels you input here are meant to indicate a level of segmentation, not the individual items. Make sure you erase the default names (Mary John bell), because they make no sense to you later. The "Tier names" are used to provide a label for intervals or specific discrete time points. The labels that appear in the "Point tiers" box are automatically assigned to point tier, whereas the labels provided in the input window for the "Tier names" are assigned to temporal intervals for e.g., the durations for the words in a given utterance.
Figure 5.2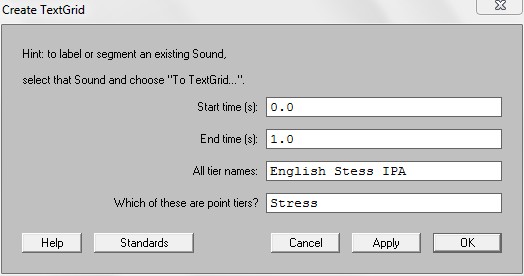
You can open the sound file and the Textgrid by selecting both the speech object and the Textgrid (they share the same name) using the CTRL-key (click on speech object, depress CTRL-key and then click on Text grid) and press "View and Edit" on the right hand side of the window and the following window will appear:
Figure 5.3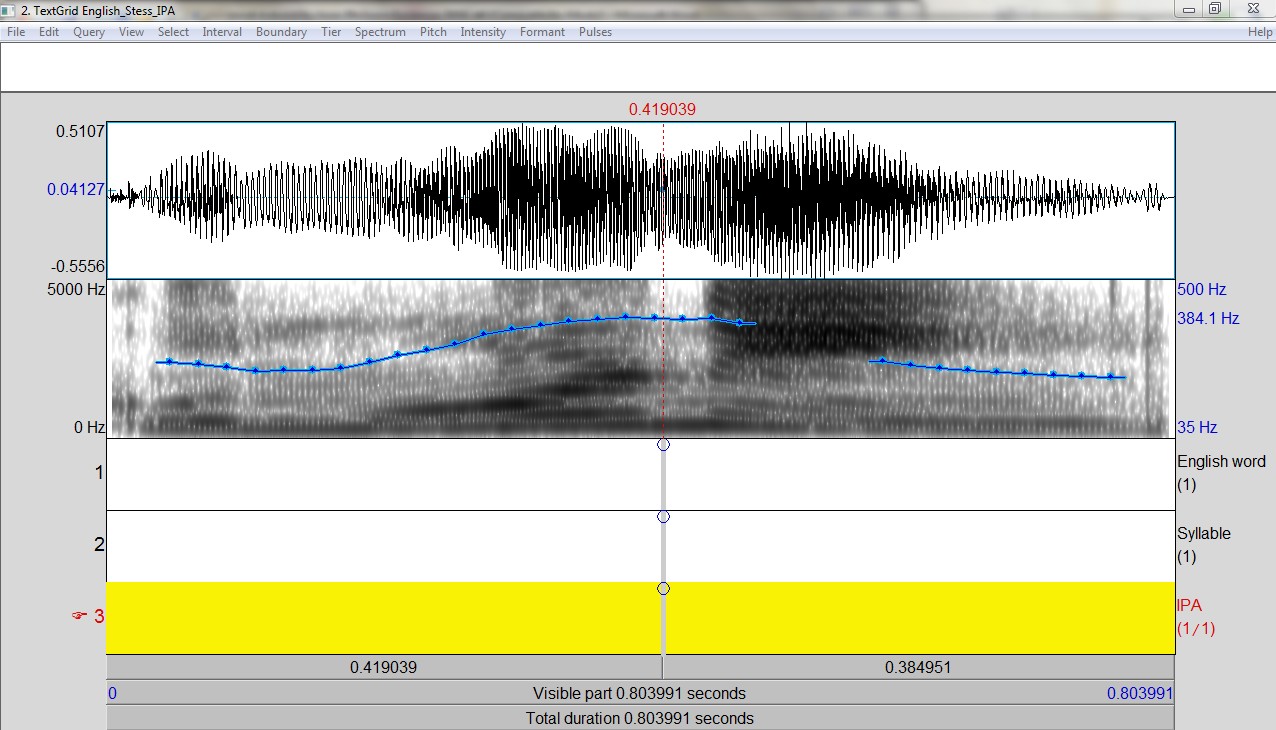
You can listen to the entire speech sample by clicking on the horizontal "Play" bar labeled "Total duration…" (at bottom of the picture). The other "Play" bars above this one are divided in segments, as determined by the cursor position and/or your selection.
The TextGrid window looks like the previous Edit window with a third pane (below analysis) and three additional menus (Interval, Boundary, and Tier). The new pane shows the tier(s) for annotation. If several tiers are shown, a red hand on the left tells which one is selected. You can zoom and select the sound as in the editor window but not edit the sound (cut/copy/paste) (Philippe Goldmam, 2004, p.8).
Figure 5. 4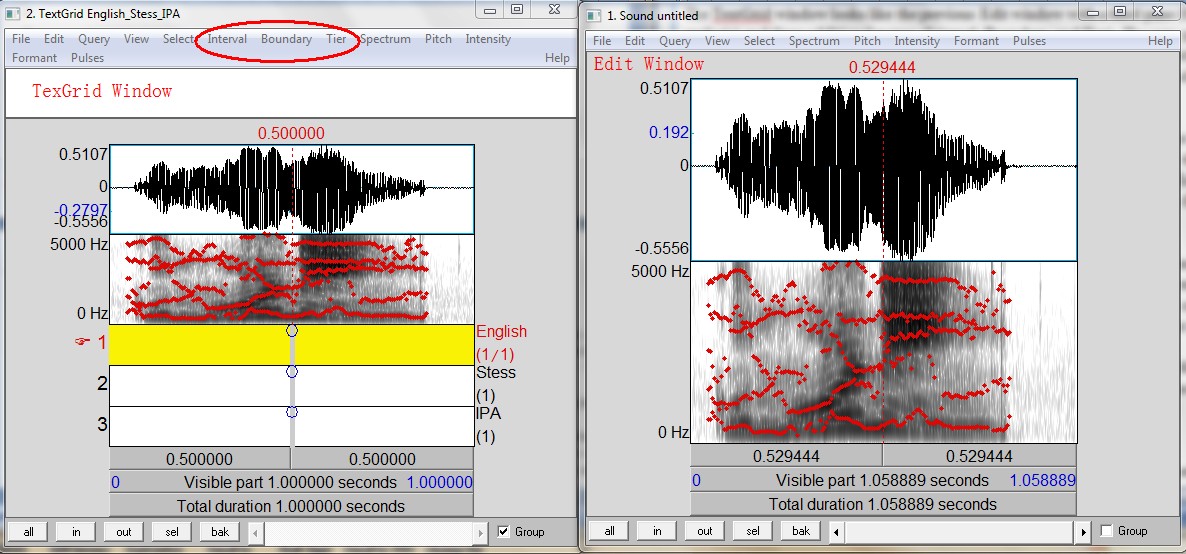
1) To select a portion of the total sound, you can click left to the start of the middle sentence and then while keeping the left-mouse button depressed move the selection window to the right. Release the mouse button, and the portion will be selected (a pinkish colored shadow will cover the selected part). Then click "View" (lower left corner of the window). This will create a new window, zooming in on your selection.
2) To add a boundary, click on the signal (or analysis) pane to set the main cursor wherever you want. Notice the vertical red dashed line is doubled with a grey thick line in each tier with a circle at the top of it. Then, three possibilities exist:
- Click Enter, and then a new boundary will be created in the selected tier
- Ctrl+F1 to add on the first (top) tier, Ctrl+F2 to add on the second, and so on… Ctrl+F9 to all on all tiers
- Click on the circle of each tier you want to add a boundary to.
- Then the boundary becomes red. It is selected. Unselected boundaries appear in blue.
3) To insert text, simply select the boundary or interval to annotate and type in some text. You can do it just after the boundary creation. The label will appear at the boundary (if point tier) or after the boundary (if interval tier) in the text editing pane, just below the menus. Note that the Cut/Copy/Paste options in the Edit menu are meant to edit this text (not the signal). You can edit the text as long as the boundary/interval is active. To remove a boundary, make sure you select the right boundary, then Menu Boundary>Remove or Alt+Backspace.
4) To remove a boundary, make sure you select the right boundary, then Menu Boundary → Remove or Alt+Backspace.
5) To move a boundary, select it and drag it.
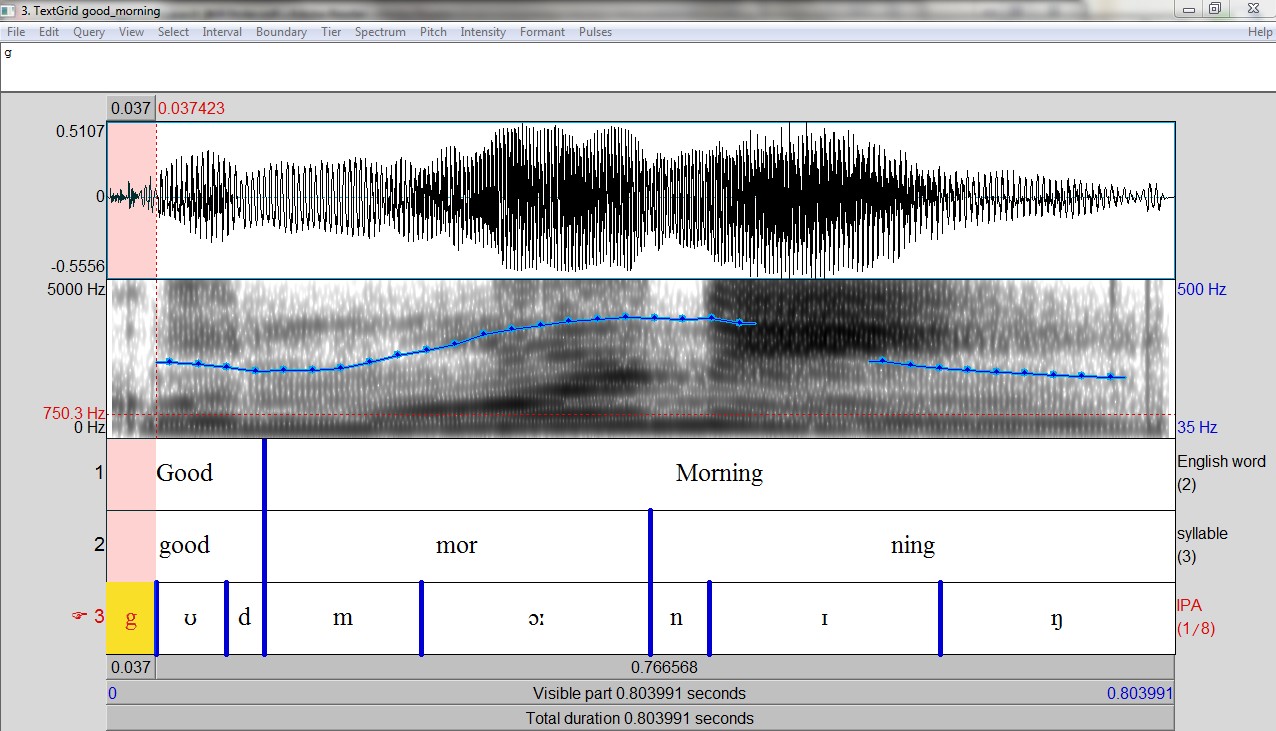
You may want to hide the analysis (by unchecking "Show" in each analysis menu, or with the "View ' → "Show Analyses..." option) for a larger view of the signal and the tiers, although the analysis may be helpful for an accurate annotation. In the following figure, see the waveform and four interval tiers (English words, linking, pause, and lexical stress) (Philippe Goldmam, 2004, p.8).
If you are finished segmenting the words, it should look similar to this:
Figure 5.5
- First select the "Praat picture" window.
- Determine the physical size of the plot by changing the selection in the "Praat picture" window (pink rectangular shape) before you draw the graph. Click in an area of the "Praat picture" window (e.g., left upper corner) and while keeping the left-mouse button depressed draw the new shape.
- Now close the "TextGrid" window, make sure both objects (sound + TextGrid) are selected in the main "Praat objects" window, and choose 'draw' from the menu on the right side of window (stick to default values).
- This will create a plot in the "picture window" as follows of the acoustic signal with the labels below it (in this case only for the middle sentence).
Figure 5.6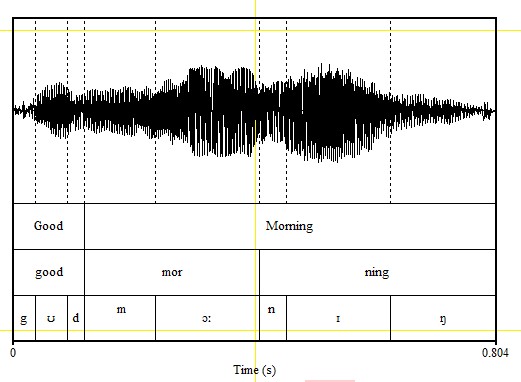
-
- If you want to show only the part you have labeled, create a new plot shape in the picture window and repeat the previous steps for drawing, but now specify begin and end time (in seconds) for the labeled part.
- Alternatively, you can repeat the process for only a selection of the original signal. This picture can be saved as a post-script file and printed directly using CTRL-P (or "print" from the file menu) if a Windows printer is connected to your PC.
Hits: 10337