
A graphic representation of three dimensions of sounds in terms of their component frequencies is called a spectrogram. In a spectrogram, time is always represented on the x-axis and frequency on the y-axis. Intensity is depicted by the relative darkness of the frequencies shown.
Figure 2.2 Spectrograms of American English Vowels
Figure 2.3 Figure Spectrograms of British English Vowels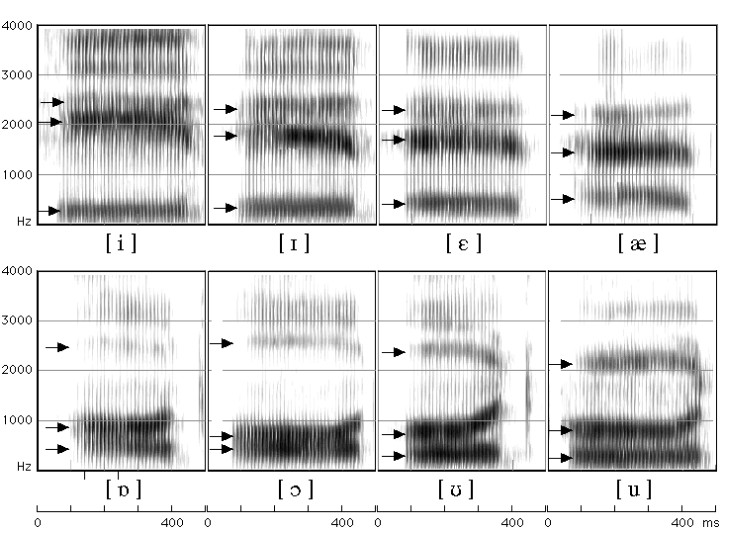
(Ladeforged, 2006:185-187)
Remarks:
- The horizontal scale shows time intervals in second(s) and the vertical scale shows frequency in Hz
- Only front and back vowels are presented in the pictures, /ə/ and /ɜ/ in middle position are not included
- The IPA fonts in Ladefoged (2006) and Roach (2009) have the following equivalences:
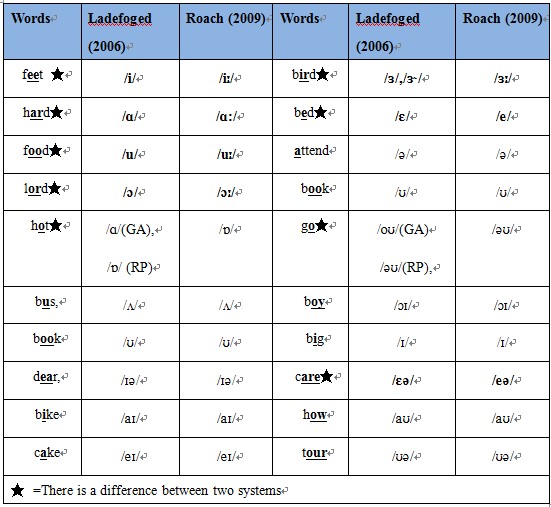
Figure 2.4 The frequency of the first three formants in eight American English vowels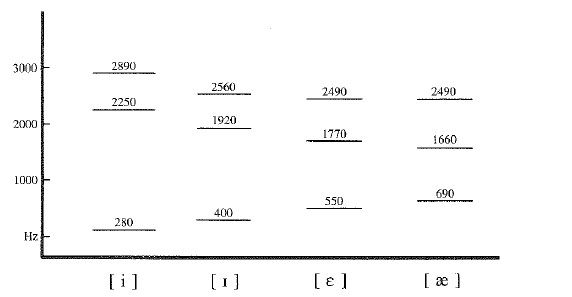
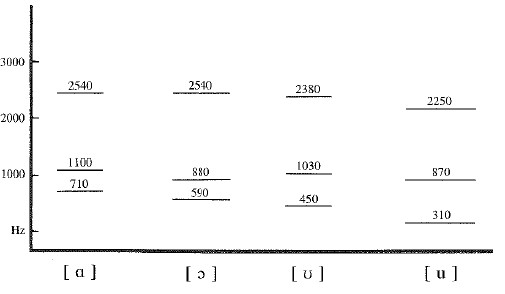
(Ladefoged & Johnson, 2011:193)
F1: The first formant (F1) in vowels is inversely related to vowel height, i.e. the higher the formant frequency, the lower the vowel height (and vice versa).
Figure 2. 5
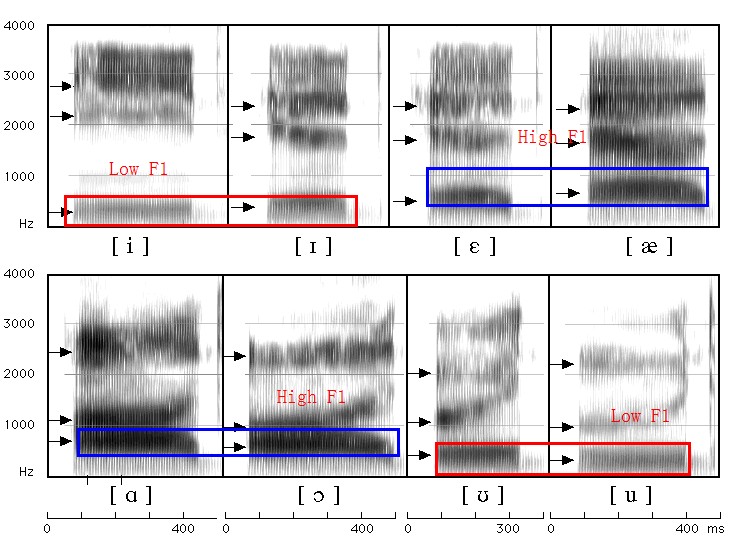
Notes: Red indicates high vowels with low F1; Blue indicates mid/low vowels with high F1
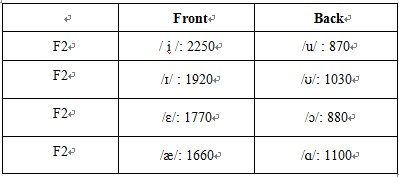
F2: The second formant (F2) in vowels is somewhat related to degree of backness, i.e. the more front the vowel, the higher the second formant (but affected by lip-rounding).
Figure 2.6
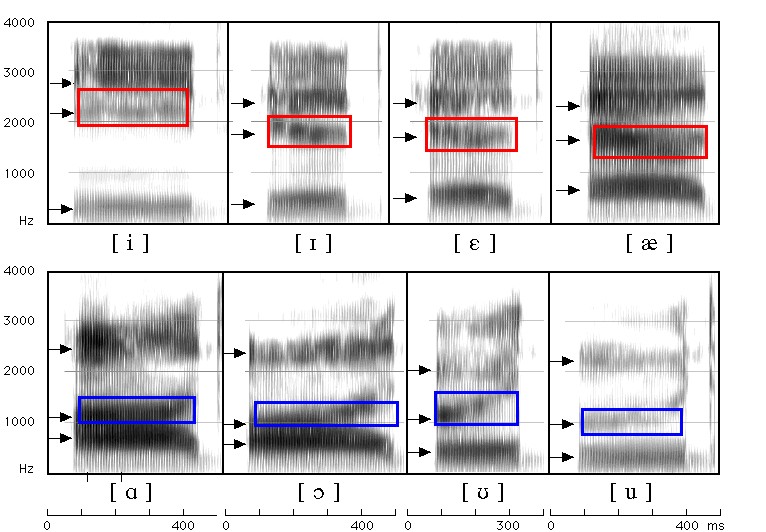
Notes: Red indicates front vowels with higher F2; Blue indicates back vowels with lower F2
F3: The lower of the formant frequency, the rounder shape of the lip e.g. /ʊ/, /uː/, but F3 is not as frequently used as F1 and F2.
(Revised from http://www.u.arizona.edu/~ohalad/Phonetics/notes/Formants%20Spectrograms%20and%20Vowels.PDF)
Before we start to plot the vowels, let’s review on how to extract formant values (see details in 1.4.5.)
- Position the cursor in a stable and middle part of the sound and do the following
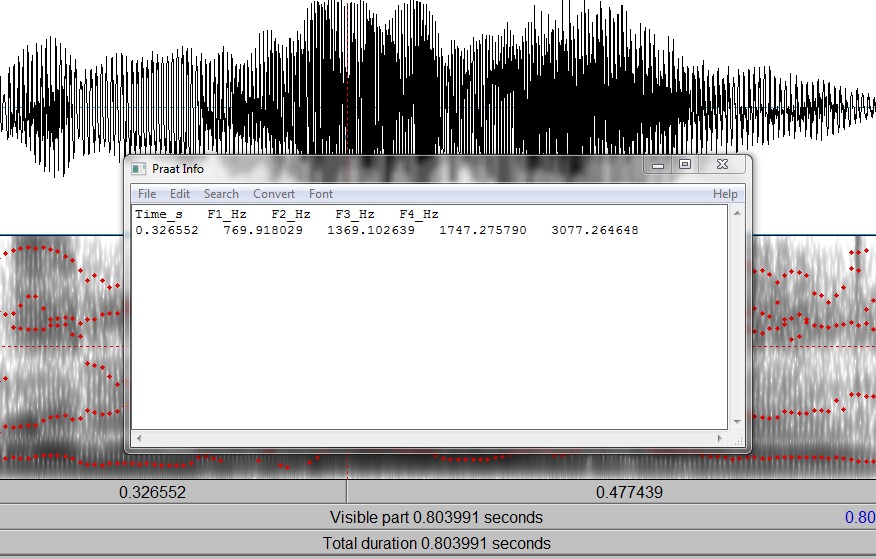
- Go to "Editor"→"Formants" →"Formant Listing", which will give you values for F1, F2, F3 and F4, along with the time point at which the measures were taken.
Figure 2.7
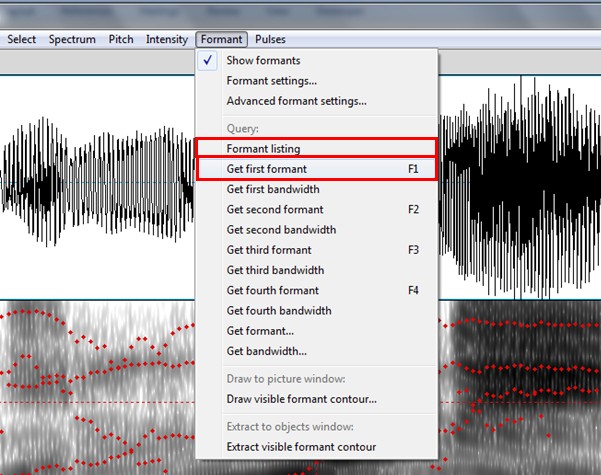
Figure 2.8
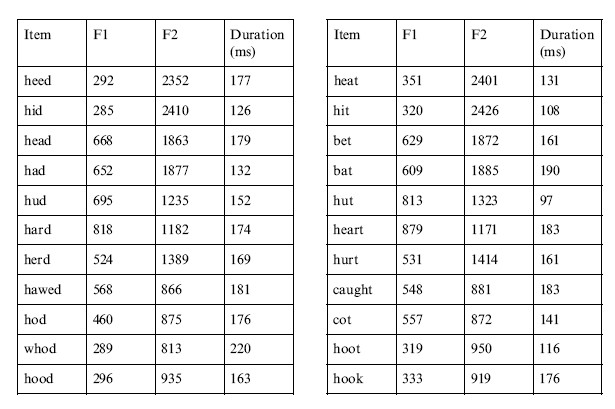
In our research, after getting F1 and F2 of the vowels from Praat, what we need to consider is how to present them in an informative way. Hung (2000: 341) has given us a good example to show the vowels (See Figure 2. 9 and Figure 2.10).
Figure 2.9 Figure Formant frequency chart for HK speaker 2
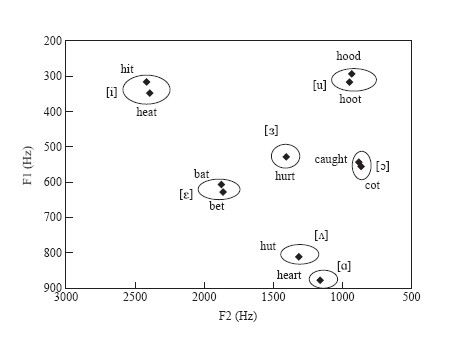
After that, you can convert your data in Excel to make the following formant chart.
Figure 2.10 Formant chart for HK speaker 2
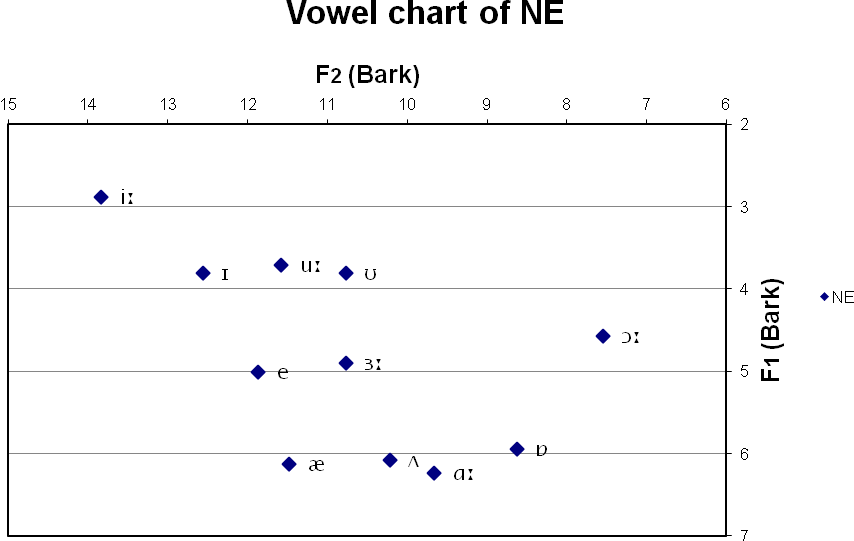
However, in order to make the formant chart reflect the real position of different vowels in oral cavity, it is better to convert the formant values (in Hz) to the auditory Bark scale using the formula of Zwicker and Terhardt (1980) and plotted on a chart of F1 (on the y-axis) against F2 (on the x-axis), to give a representation of the open-close and front-back quality of the vowels.
In the following link, you can find a very useful website prepared by David Deterding (2006) for measuring and plotting vowels http://videoweb.nie.edu.sg/phonetic/vowels/measurements.html.
In this website, you can find an Excel empty template for you to record the formant values of the vowels you measured. You can either enter the formants of each vowel separately, with one worksheet for each vowel of RP British English, or you can enter the final values directly into the "summary" worksheet.
The formant values (in Hz) are then converted to the auditory Bark scale using the formula of Zwicker and Terhardt (1980) and plotted on a chart of F1 (on the y-axis) against F2 (on the x-axis) automatically.
The following vowel chart of RP is made by Deterding using the template he uploaded.
Figure 2.11 Vowel chart of NE
Hits: 210794