
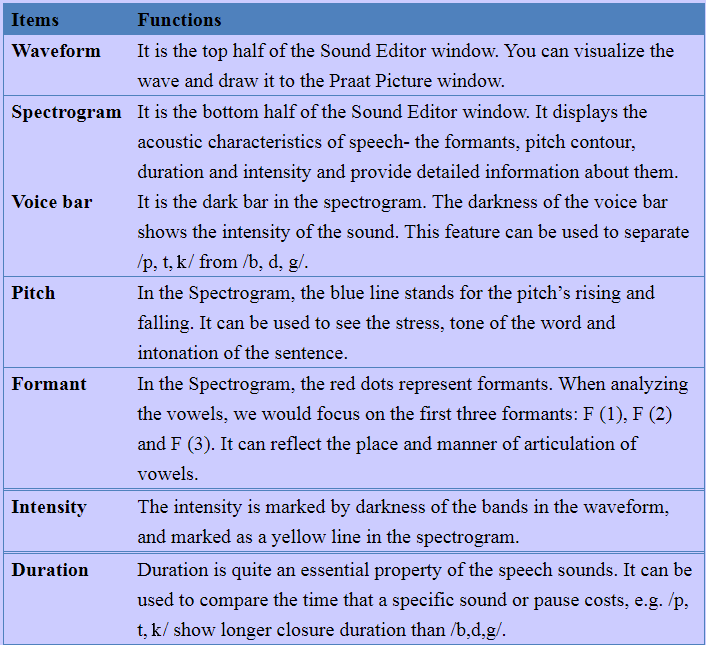
Before using Praat to do sound analysis, we have to be clear about know that what information we can get from Praat. Table 1 presents some major acoustic variables we usually use to analyze the speech sounds. (See Figure 1. 49) for visual presentation of the variables.
Figure 1.49
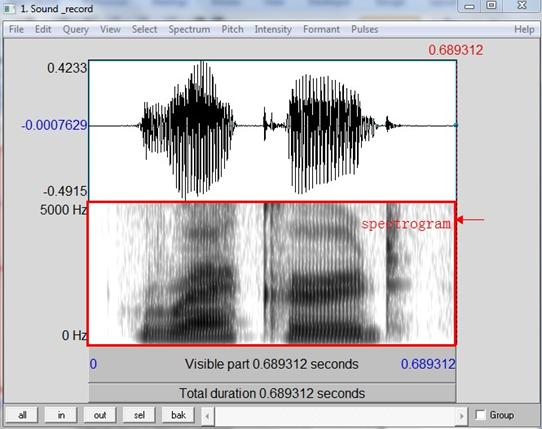
Table 1.1
A. Showing the Spectrogram
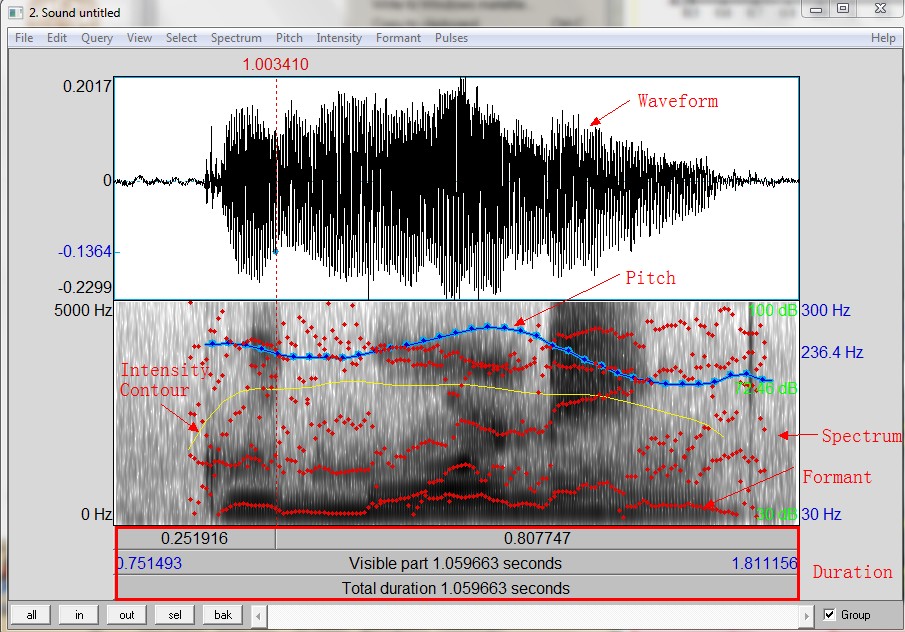
Normally the waveform and spectrogram will be presented automatically if you select one file and click "View and Edit"as Figure 1.50.
Figure 1.50
B. Adjusting the Spectrogram Settings
The most important settings here are the window length and view range.
1) View range (Hz)
View range decides how much of the spectrum is shown. For speech, we normally set the range from 0 to 5,000 or 6,000 Hz, but for examining fricatives, we might need to set it as high as 15,000 Hz. For music, we may need to focus on the area from 100 to 2,000 Hz. (Revised from Styler, 2012)
You can adjust the View range by clicking "Spectrum" → "Spectrogram Settings"
Figure 1.51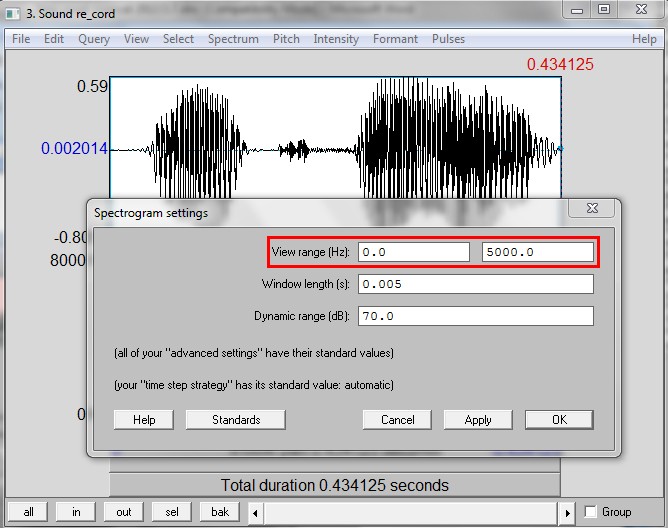
b) Window length
Praat can provide you with both Broadband spectrogram and Narrowband spectrogram by adjusting the window length. The shorter the window length, the larger its bandwidth (Bandwidth = 1.299 / window length). There is no clear cut boundary between Broadband spectrograms and Narrowband spectrograms, if the window length is around 3-5 ms (bandwidth: 200-300Hz), the resulting spectrogram is called "wideband". For the window length around 20-30ms (bandwidth: 30-50Hz), the spectrogram is called "narrowband". Wideband spectrogram is used to observe the formant structure while narrowband spectrograms reveal the harmonic structure (pitch information).
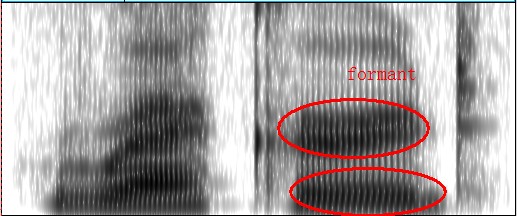
- Broadband spectrogram (Window Length: 0.005s) is used to observe the formant structure of sound, and it is the default setting in Praat. (See Figure 1.52)
Figure 1.52
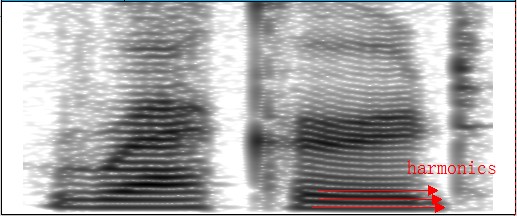
- Narrowband spectrogram (Window Length: 0.025s ) can be used to look at the harmonics structure (F0 / Pitch information) (Figure 1.53).
Figure 1.53
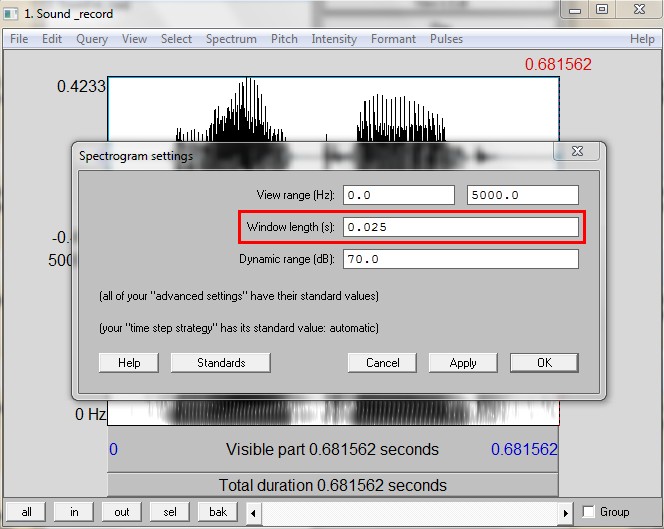
You can adjust the window length by clicking "Spectrum" → "Spectrogram Settings" → set the "Window Length" to 0.025s (or the narrowband window length of your choosing) → Click OK.
Figure 1.54
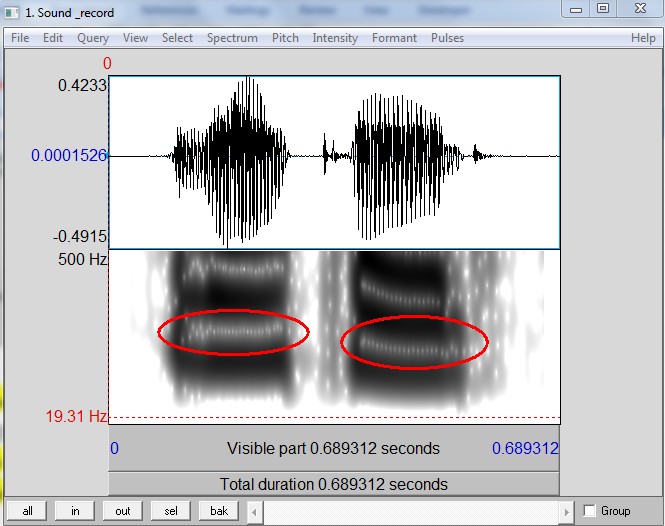
Now, you can see harmonics clearly in this narrowband spectrogram.
If you set the view range roughly as 0-500 Hz for speech in this narrowband spectrogram, the contours of the harmonics will accurately represent the pitch contours of the voice, which can give you a sense of the pitch (F0) contour before using the Praat pitch tracker for more precise measurement.
Figure 1.55
To return to a broadband spectrogram, you can click "Spectrum"→ "Spectrogram Settings" → Set the Window Length to 0.005 (or the broadband window length of your choosing) → Click OK
And then you’ll be back to the default broadband spectrogram.
Before we illustrate how to measure pitch in Praat, let’s discuss what the pitch is and what it used for.
Pitch is a term used to refer to variations in fundamental frequency (F0), which serves as an important acoustic cue for tone, lexical stress, and intonation. For example, in Chinese, which is a tone language, each syllable or morpheme may have its own pitch.
A. Extracting information about pitch
- Display the pitch track: Pitch → Show pitch
- At this point, a blue line will be placed on the spectrogram representing the pitch. At this time, you can place the cursor at the point and read the blue number on the right side of the window.
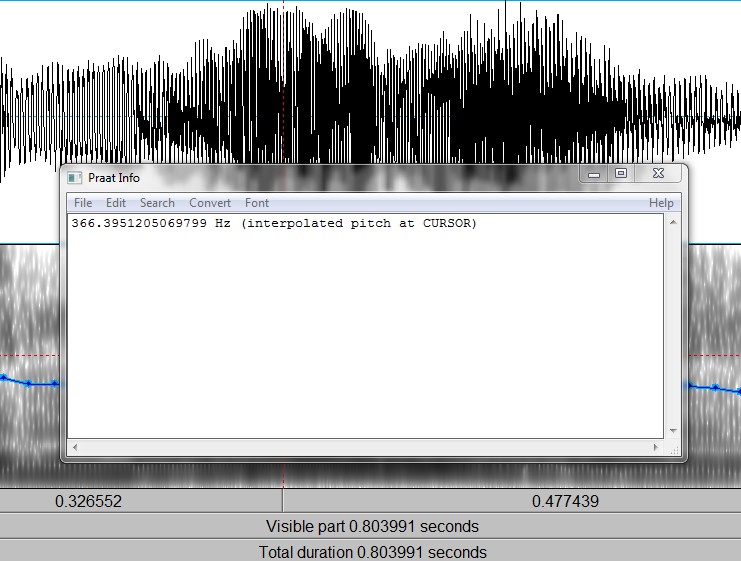
- Or you can position the cursor in a stable middle part of the blue track and click "Pitch" and then select "Get pitch". A local pitch value will be displayed in a separate window.
Figure 1.56
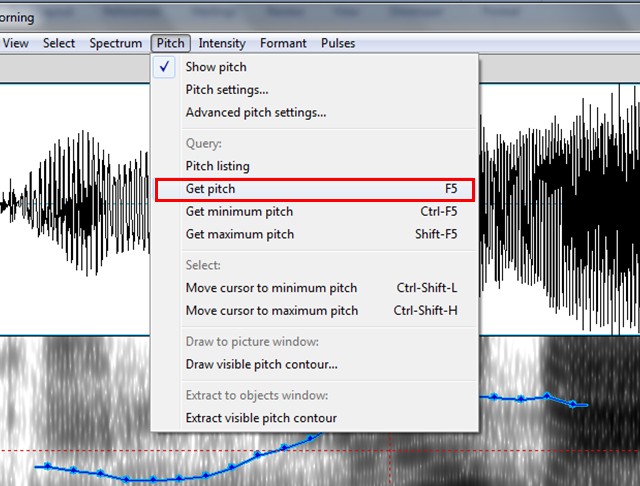
Figure 1.57
 B. Getting Maximum, Minimum, and Average pitch for a section of speech
- Select the portion of the sound for which you would like the Maximum, Minimum or Average Pitch
- Select the proper command for your task from the top menu: Pitch → Get Pitch/Get Maximum Pitch / Get Minimum Pitch
C. Improving the pitch contour by adjusting the pitch settings
Sometimes you will find that the blue pitch contour jumps up and down, doubling and halving the actual F0, and in many cases, especially where the speaker is creaky, the pitch track will drop out altogether, which is because Praat’s default pitch range is not appropriate for the file you’re analyzing. Therefore, in order to make the pitch track more visible and better reflect the speaker's voice , you may need to adjust some of the pitch settings via Pitch → Pitch settings (see Figure 1.58).
Figure 1.58
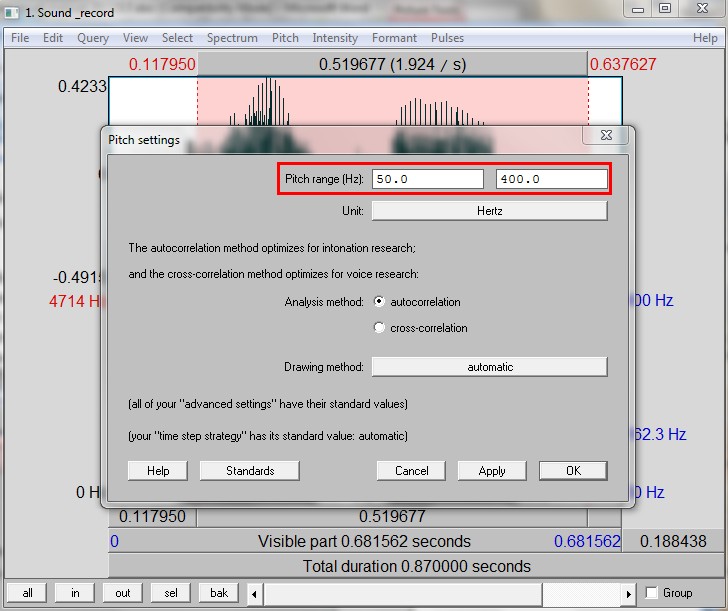
The fundamental frequency of the voice (pitch) usually ranges from approximately 30–300 Hz, but this varies according to different speakers: typically males’ pitch ranges from 50-180Hz and females from 80-250Hz, so we usually set the pitch range to a reasonable range of 50-400Hz for general usage.
If you have a general sense on what the speaker's actual range is (e.g. getting from the previous measuring), you can set the minimum to just under the speaker's lowest F0 and the maximum to just over their highest pitch excursion.
If the pitch contour is too low in the spectrogram, you can increase the maximum value of the pitch range (e.g. increase from 400 to 500Hz); if the pitch contour is too high, you can decrease the maximum value of the pitch range (e.g. increase from 400 to 300Hz).
(This part is adapted from Stonham's lecture notes (p.13) that is available at http://stonham.dyndns.org/phonetics/handouts/prosod_hndt.pdf)
Remarks:
On the right side of the window, you can find the fundamental frequency (F0), which is marked in blue, while on the left side, the frequency value marked in red is formant frequency.
Figure 1. 59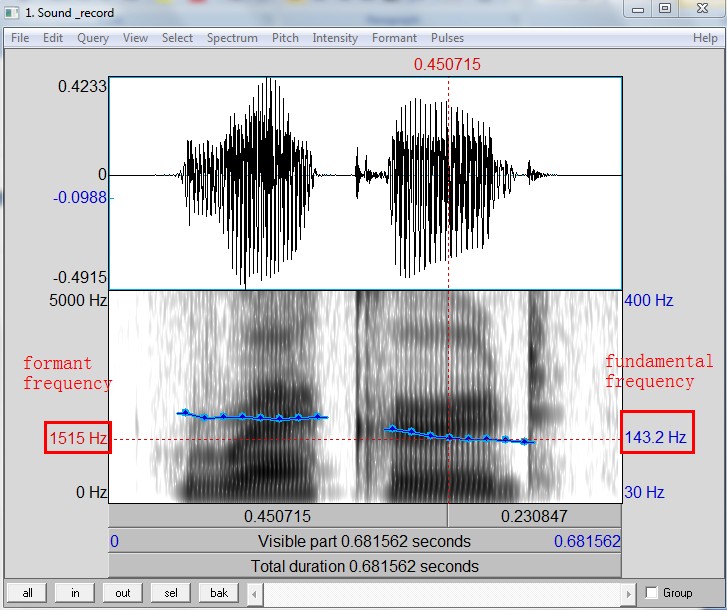
- Position the cursor in a stable middle part of the sound and do the following
- Go to "Intensity" → select "Get intensity". A local intensity value will be displayed in a separate window.
Figure 1. 60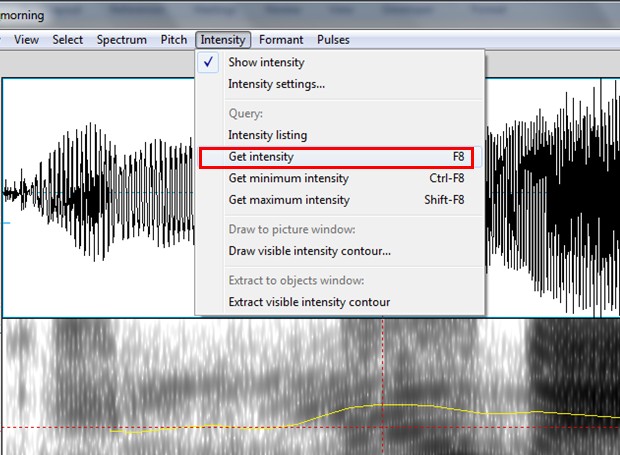
Figure 1.61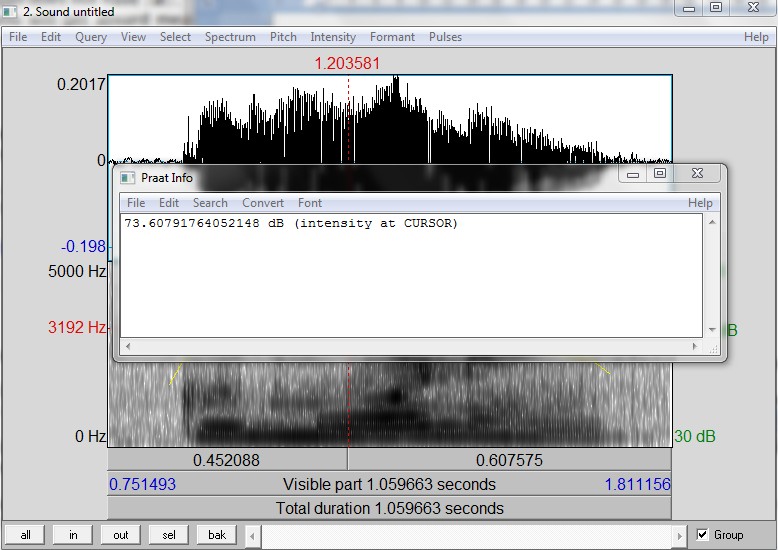
Let’s discuss how to extract information about formant values
- Position the cursor in a stable middle part of the sound.
- Go to "Formant" and select "Get first formant" (F1), The local first formant value will be displayed in a separate window.
- Do the same for the second formant (F2), third formant (F3), and fourth formant (F4).
Remarks:
- It’s more efficient to use "Editor" → "Formants" → "Formant Listing", which will give you values for F1, F2, F3 and F4, along with the time point at which the measures were taken.
Figure 1.62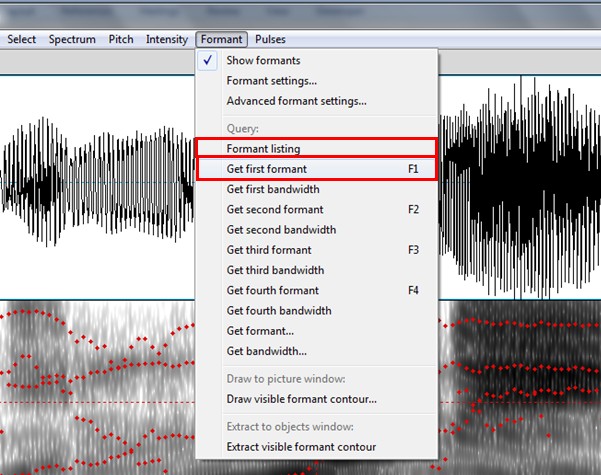
Figure 1.63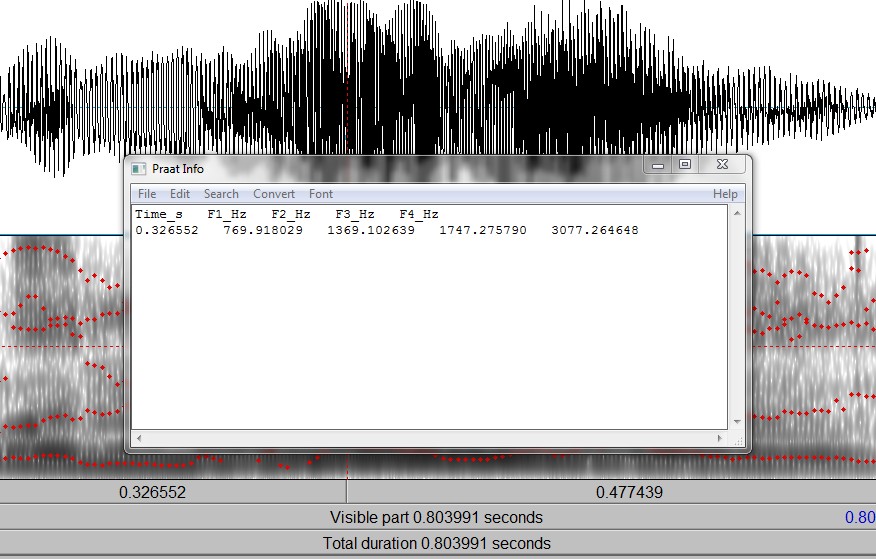
- Adjust the Formant settings to make the measure more accurate.
You can go to "Formant" and select Formant settings
-
- For the male, set the maximum formant (Hz) as 5,000Hz
- For the female, set the maximum formant (Hz) as 5,500Hz
- For the children, set the maximum formant (Hz) as 8,000Hz
Figure 1.64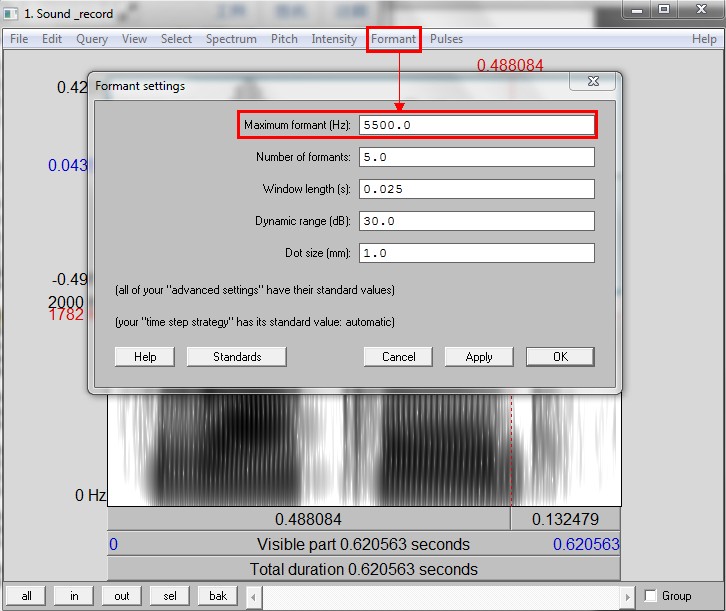
Hits: 51483